Milesight-Troubleshooting-Heat Map
Milesight-Troubleshooting-Heat Map.pdf

1. What is Heat Map
With scenario-adaptable and flexible configurations, Milesight Advanced Heat Map is embedded into the Panoramic Series, which can analyze customers movement to reveal insights for better business management with the intuitive and accurate statistical analysis results in time or space pattern as needed.
2. How to Set Heat Map
(1) Model
· 360° Panoramic H.265 Fisheye Network Camera
· 180° Panoramic H.265 Mini Bullet Network Camera
Note:1. Currently Heat Map is only supported in the original view of 360° Panoramic Fisheye Network Camera and the dewarping view of 180° Panoramic Mini Bullet Network Camera.
2. Please upgrade the camera to V43.7.0.72-r7 to use Heat Map function.
3. Only allowed to view reports within 7 days without a SD card or NAS.
(2) Settings
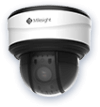
Step1: After log in the web, go to “Advanced Settings“→ “Heat Map“. Check the checkbox “Enable Heat Map”, then set the Heat Map settings as shown below.
[Sensitivity]: Level 1~10 are available, the default level is 5. The higher the sensitivity, the easier it is for moving objects to be recorded in the results.
[Min. Object Size]: Set the minimum object size from 1 to 100, the default value is 10. Objects smaller than this value will not be recorded in the result.
[Min. Dwell Time]: Set the minimum dwell time from 1 to 300, the default value is 30. If the object stays in the area longer than the set "Minimum Dwell Time", it will not be recorded in the result.
[Scene Change Adaptability]: Level 1~10 are available, the default level is 5. Scene Change Adaptability indicates the camera's adaptability to scene changes, which can increase the accuracy of detection. The camera better adapts to faster changing scenes if the value is higher.
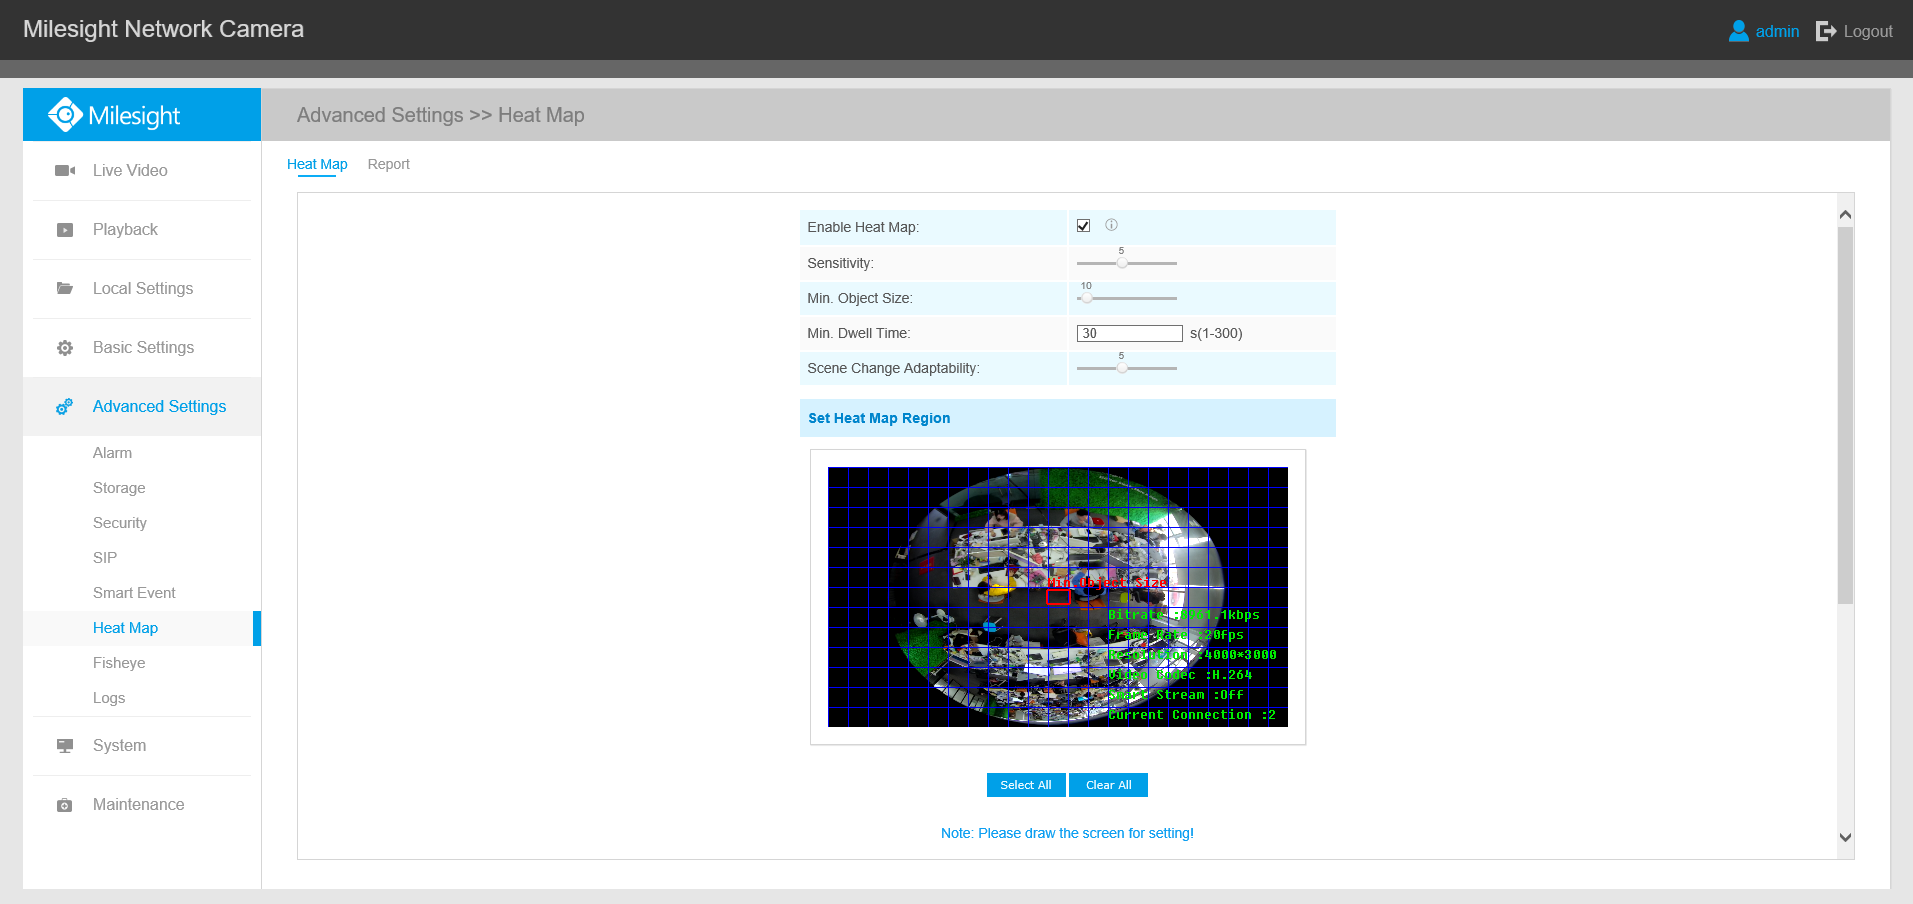
Step2: Set Heat Map Region. Draw the screen to set the detection area. You can click “Select All” button to select all areas, or "Clear All" button to remove the current drawn area.
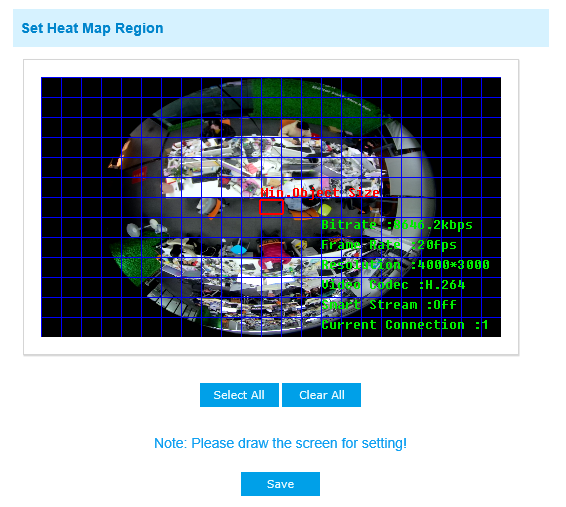
Step3: Schedule Settings. You can draw the schedule by clicking“Edit”button. And then click “Save” or “Reset” after finishing setting.
(3) Report
The results will be displayed on “Report” interface.
Step1: Select Main Heat Map Type.
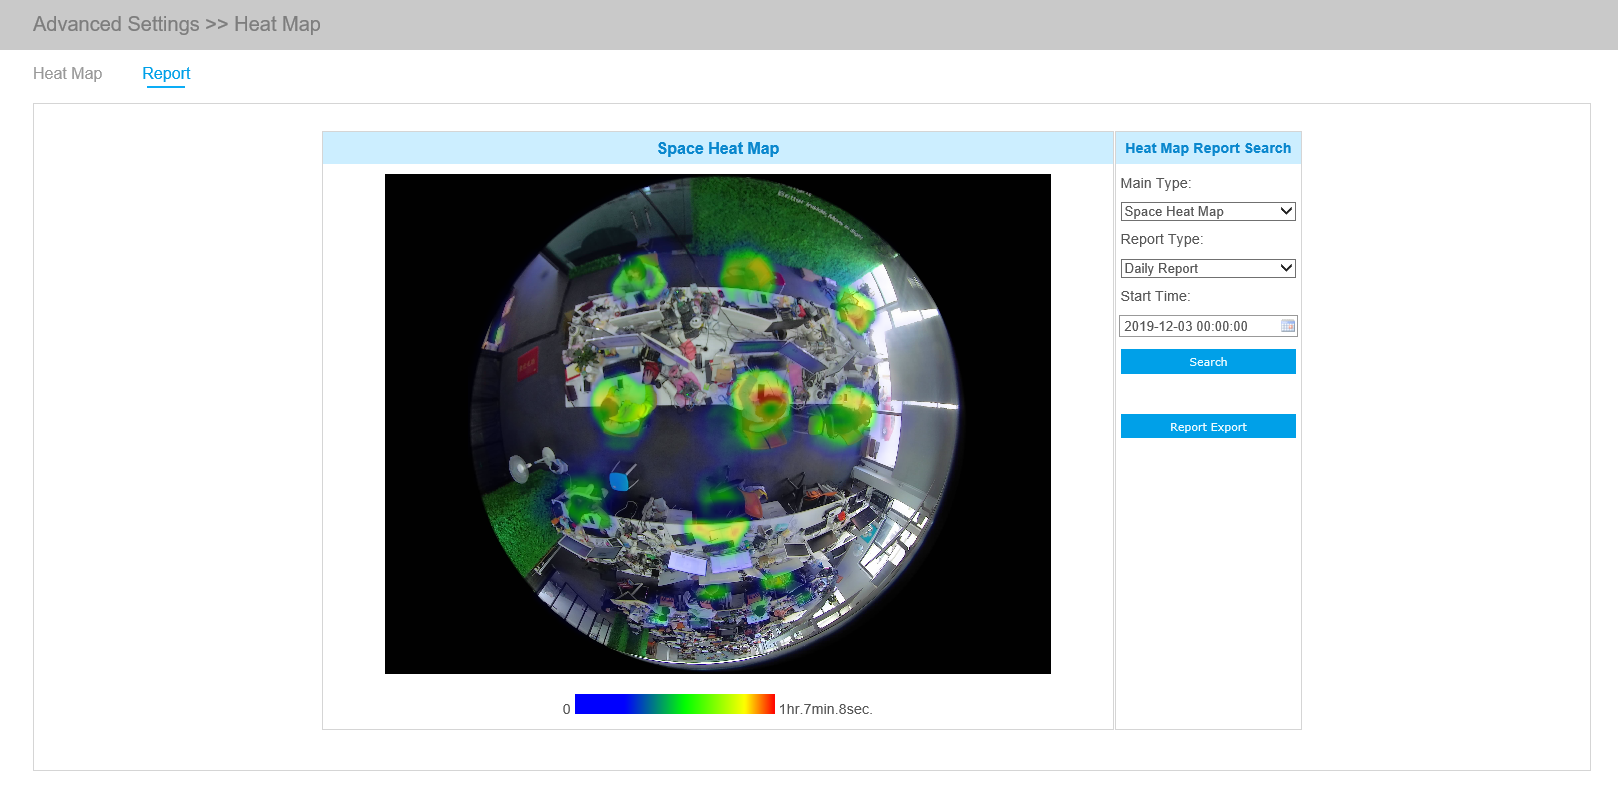
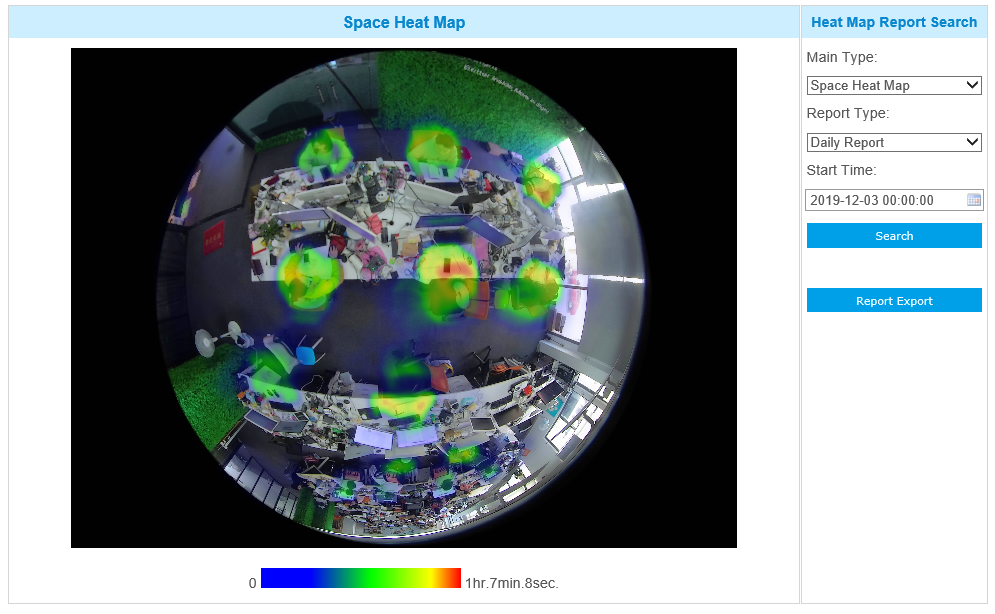
[Space Heat Map]: Space Heat Map will be presented as a picture with different color. Different colors represent different heat values. Red represents the highest and blue represents the lowest.
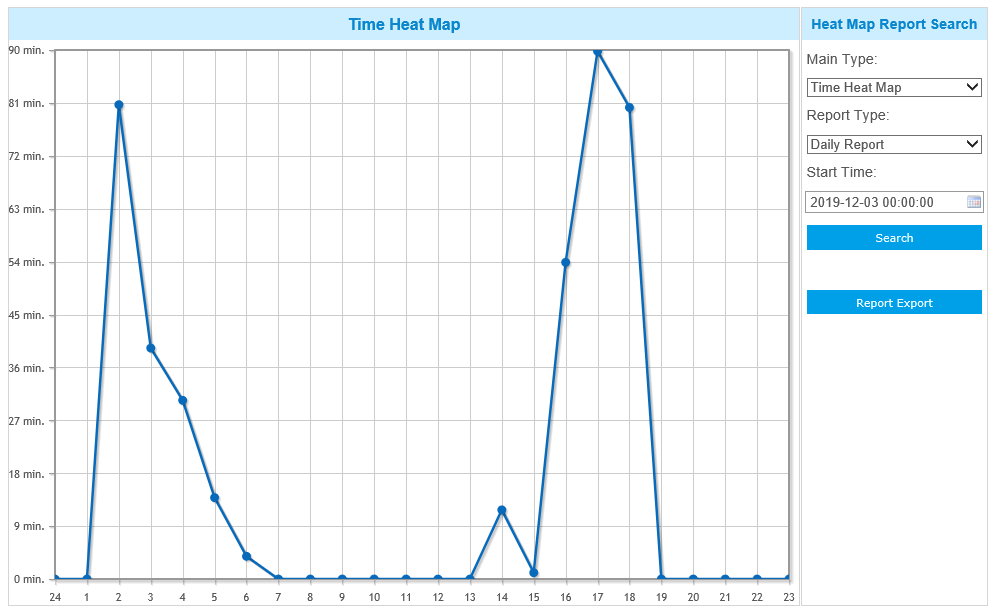
[Time Heat Map]: Time heat map will be presented as a line chart to show the heat at different times.
Step2: Select Report Type including Daily Report, Weekly Report, Monthly Report and Annual Report.
Step3: Select Start Time, then click the “Search” button, the camera will automatically count the data for the day/ week/ month/ year (based on the report type selected by the user) from the start time and generate the corresponding report as shown below.
Step4: Click the "Report Export" button to export the report to local.
If the current Space Heat Map is generated, it will be saved as a png image. If the current Time Heat Map is generated, it will be saved as a csv form.